Best Places to Retire in Virginia
- Mutual Assurance Society
- Feb 8, 2023
- 1 min read
Updated: Feb 23, 2023
So you've decided Virginia is the best state in which to spend your golden years - but which part of Virginia will suit you best?
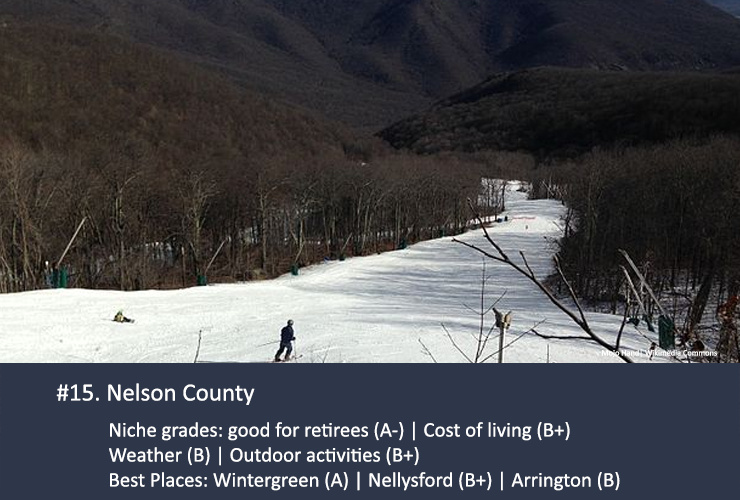
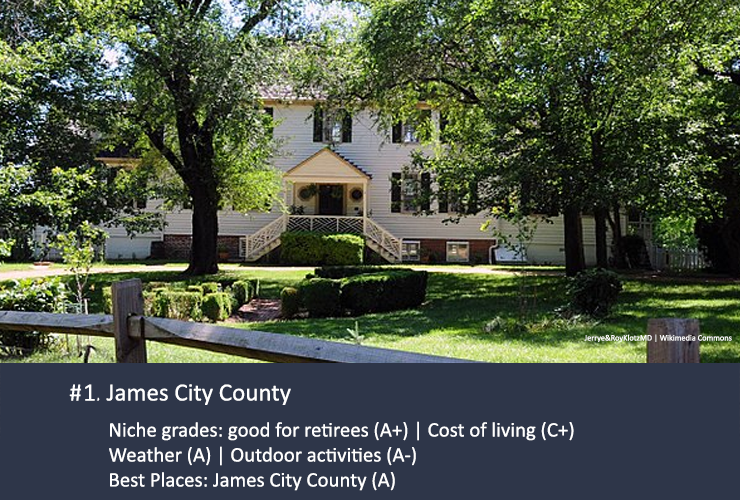
Some people are mountain lovers, while others want a beach life. A study by Stacker using data compiled by Niche, ranks the top counties in the Commonwealth according to the factors listed at the end of this page, taken from US Census, NOAA and Niche data.
Which county is calling your name?
Click on right side of image to view slides:
Factors Considered
Retiree Newcomers | The percent of residents 65 years and over who moved into the area within the last year | 15% |
Cost of Living Grade | Based on the consumer price index and access to affordable housing. | 12.5% |
Average Sunny Days per Year | The average number of sunny days per year assigned at the county level. When data was not available, the average of nearby counties was used. | 10% |
Crime & Safety Grade | Based on violent and property crime rates. | 10% |
Residents 65 Years and Older | Percentage of residents aged 65 and over | 10% |
Access to Doctors | A measure of the proximity (per square mile) and the availability (per capita) of physician's offices. | 5% |
Access to Restaurants | A measure of the proximity (per square mile) and the availability (per capita) of full-service restaurants | 5% |
Housing Grade | Based on home values, property taxes, housing costs, local schools, and more | 5% |
Retirees Below Poverty | Percentage of the population age 65 and older with income in the past 12 months below the poverty level by age group. | 5% |
Winter Average Low Temperature | The 30-year average monthly low temperature December through March, where a higher temperature is considered better. | 5% |
Winter Average Snowfall | The 30-year average monthly snowfall December through March, where less snowfall is considered better. | 5% |
Access to Golf | A measure of the proximity (per square mile) and the availability (per capita) of golf courses and country clubs. | 2.5% |
Access to Grocery Stores | A measure of the proximity (per square mile) and availability (per capita ) of grocery stores. | 2.5% |
Access to Libraries | A measure of the proximity (per square mile) and the availability (per capita) of libraries. | 2.5% |
Access to Recreation/Fitness Facilities | A measure of the proximity (per square mile) and the availability (per capita) of fitness and recreational sports centers. | 2.5% |
Higher Education Rate | Percentage of residents who have received a bachelor's degree of higher. | 2.5% |
Sources: Wikimedia schoolsCommons, Niche, Stacker.com


Comments